Daily Reports
How to read the AI-generated daily analytics reports, understand recommendations, and use visitor data to improve your Weave.
Once your Weave is live and receiving traffic, Oeave generates periodic analytics reports for each project. These reports go beyond raw numbers — they include AI-powered recommendations and conversion path analysis.
Report interval
By default, reports are generated daily. You can change the frequency to daily, weekly, or monthly from your project's Settings tab. Longer intervals aggregate more traffic data, which can surface patterns that daily snapshots might miss.
Finding your reports
Open your project and switch to the Insights tab. If a new report is available since your last visit, a New badge appears on the tab.
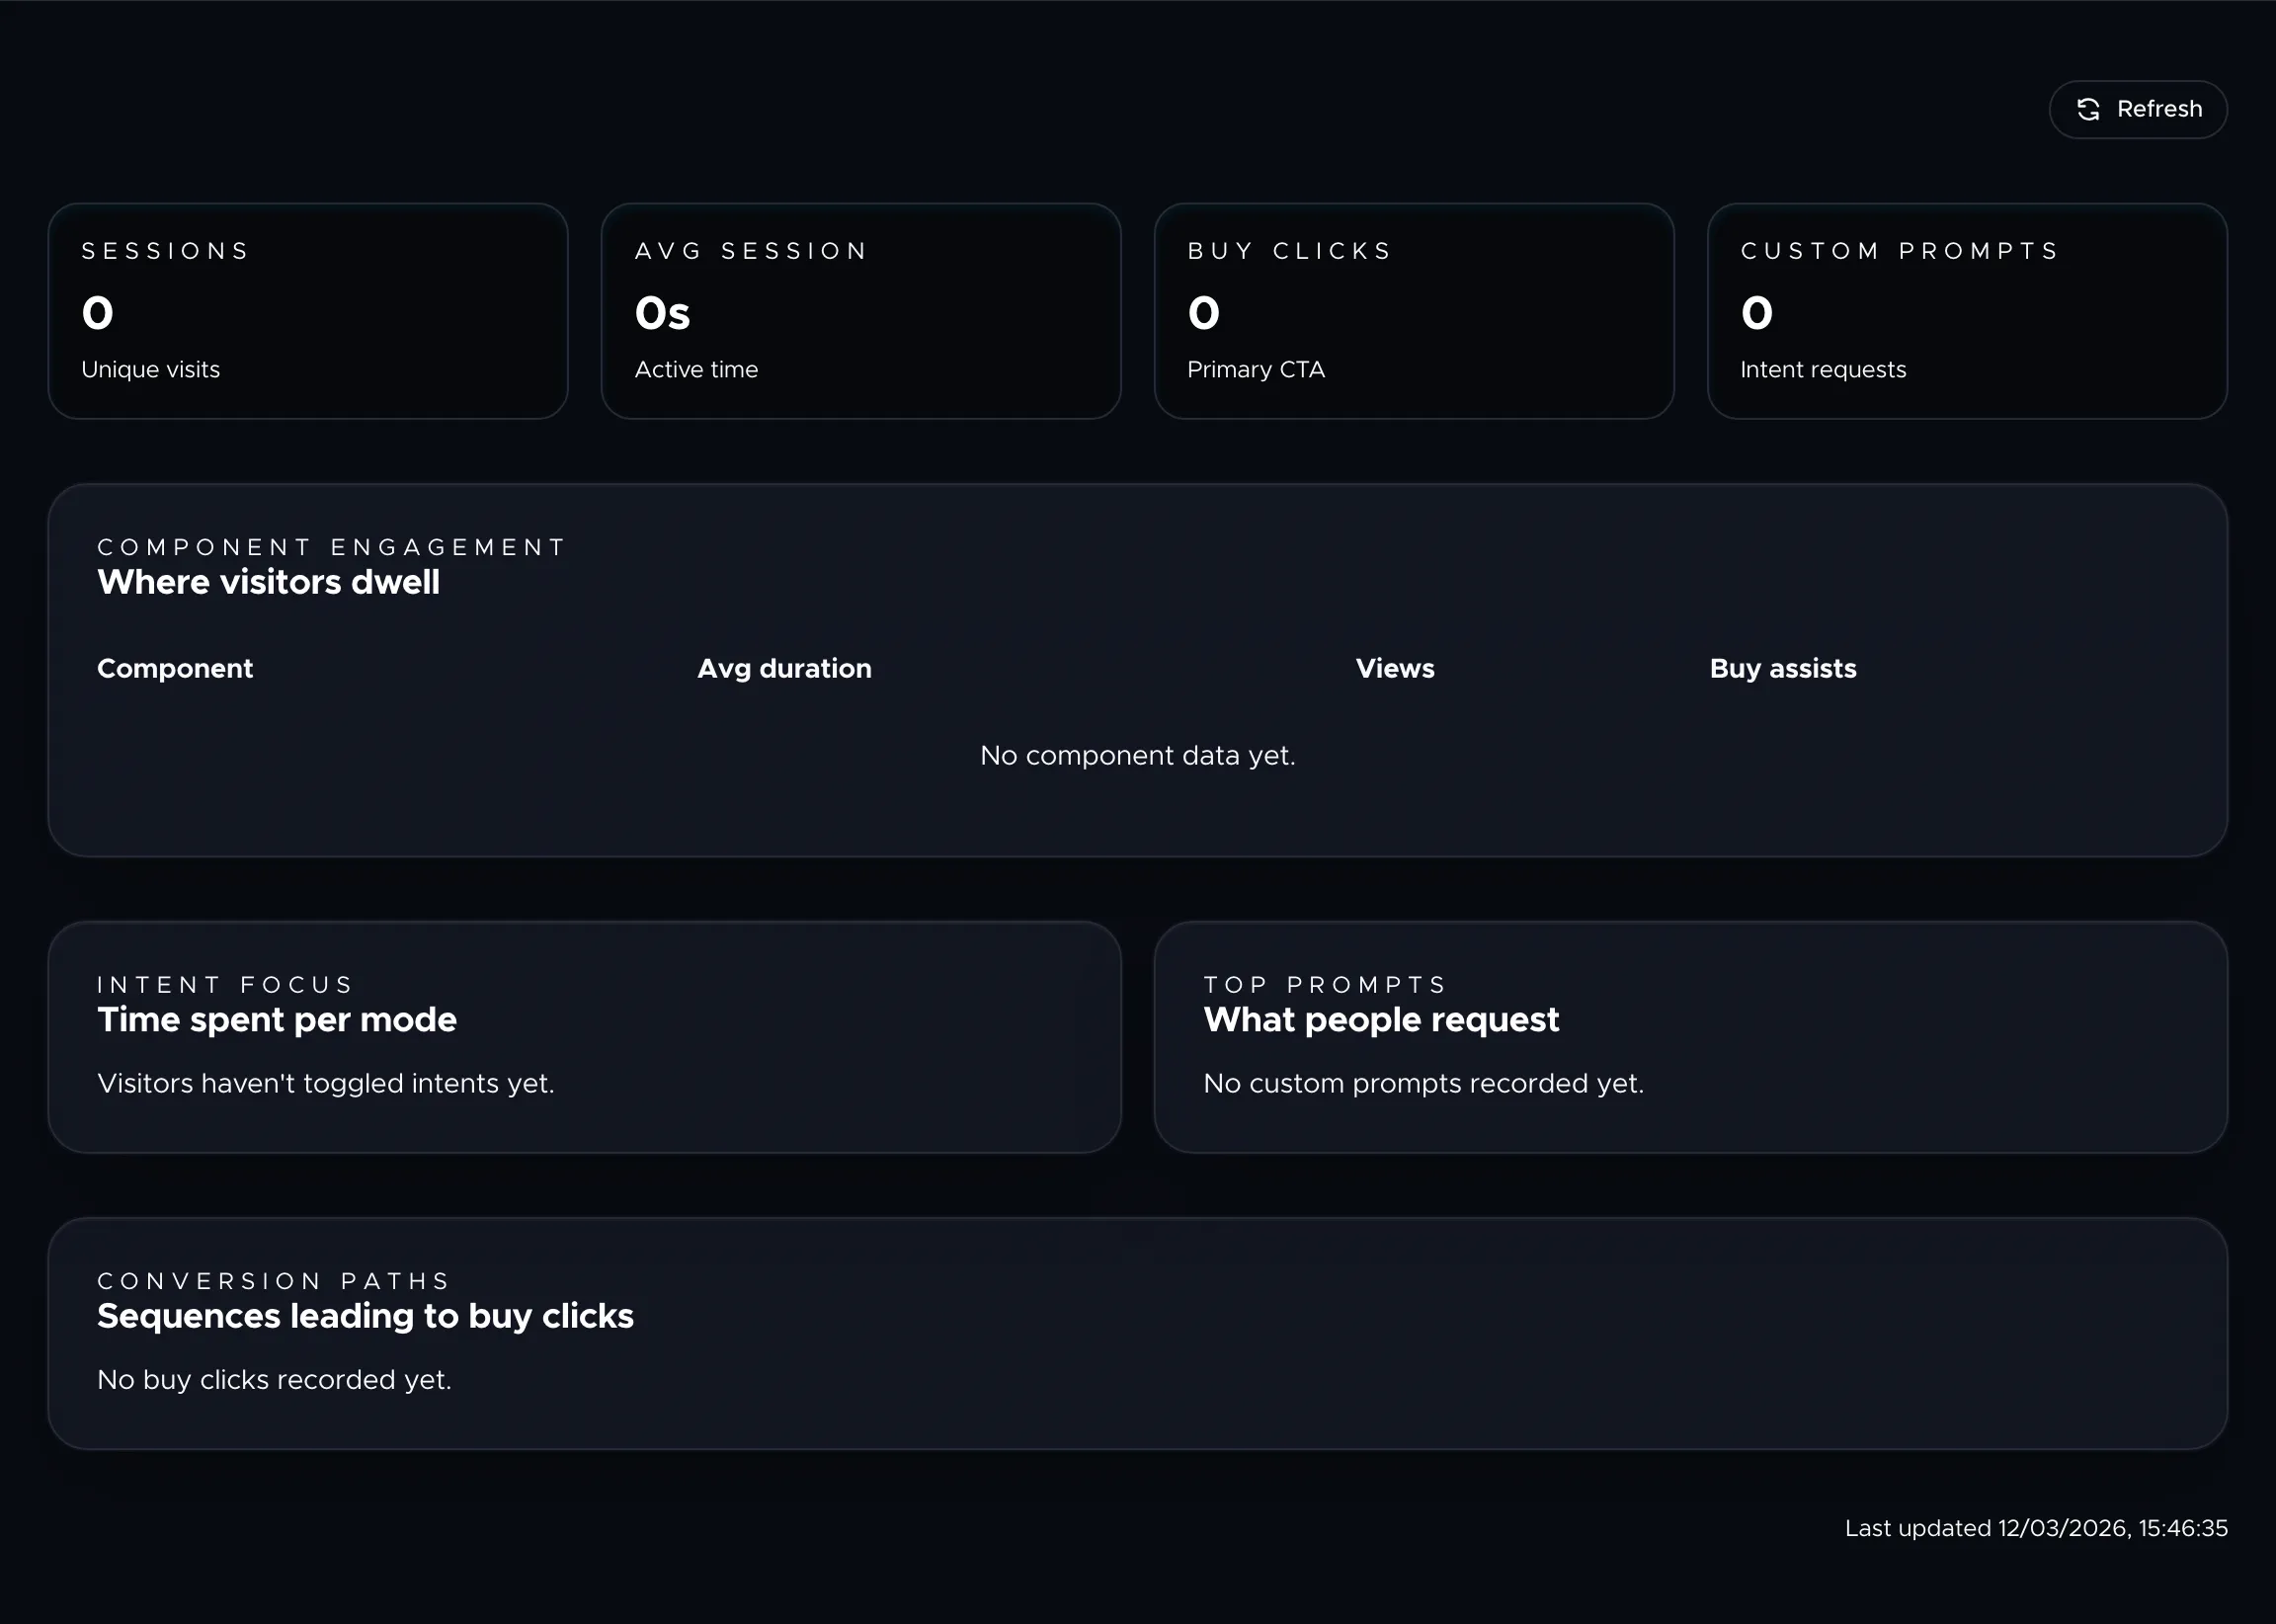
The latest report is shown in a highlighted card at the top of the insights panel with the date, key metrics, and recommendations.
What's in a report
Signal summary
A breakdown of the day's visitor signals:
| Signal | Meaning |
|---|---|
| Views | Total times the Weave was opened |
| Interactions | Clicks, swipes, and taps within the experience |
| Branches / Queries | When buyers used search or chose a different thread path |
| Dwell time | Total time visitors spent inside the Weave |
Mode breakdown
How visitors experienced your Weave:
- Scroll — used the traditional scroll layout.
- Feed — swiped through the card-based feed.
- Video — watched the cinematic video presentation.
Top thread
The thread with the highest engagement, including how much time buyers spent in it and which signals it generated.
Recommendations
AI-generated, plain-language suggestions based on the day's data. These might include:
- "Add more visuals — the carousel thread had 3× the dwell time of text-only threads."
- "Buyers are searching for pricing info — make sure your pricing thread is prominent."
- "The hero thread has high drop-off — try shortening it or adding a CTA sooner."
Conversion paths
Sequences of threads that led to buy clicks. For example: "Features → Testimonials → Pricing" appeared 12 times before a buy click. Use this to understand your strongest conversion funnels and reinforce them.
Visitor searches
A table showing what buyers typed into the search field, how many times each query appeared, how many fiber results matched, and whether a thread was auto-generated from the query.
Queries with no results are highlighted — these are content gaps you should consider filling with new fibers.
Using reports to improve
The most impactful workflow:
- Check the daily report each morning.
- Look at top prompts and visitor searches for content gaps.
- Add fibers or threads that address those gaps.
- Check conversion paths to see which thread sequences perform best.
- Rearrange or promote the threads that appear in winning conversion paths.
Next steps
For more detail on how tracking works and what each analytics metric means, see Analytics and Insights. To set up the AI-powered search that generates visitor queries, see Answer Engine Optimization.