Analytics and Insights
Understand how buyers move through your Weave with signal tracking, funnel depth scoring, and actionable reports.
Oeave tracks how each buyer moves through your Weave so you can see what is working and where people drop off. The Insights tab shows analytics summaries, signal breakdowns, and AI-generated recommendations.
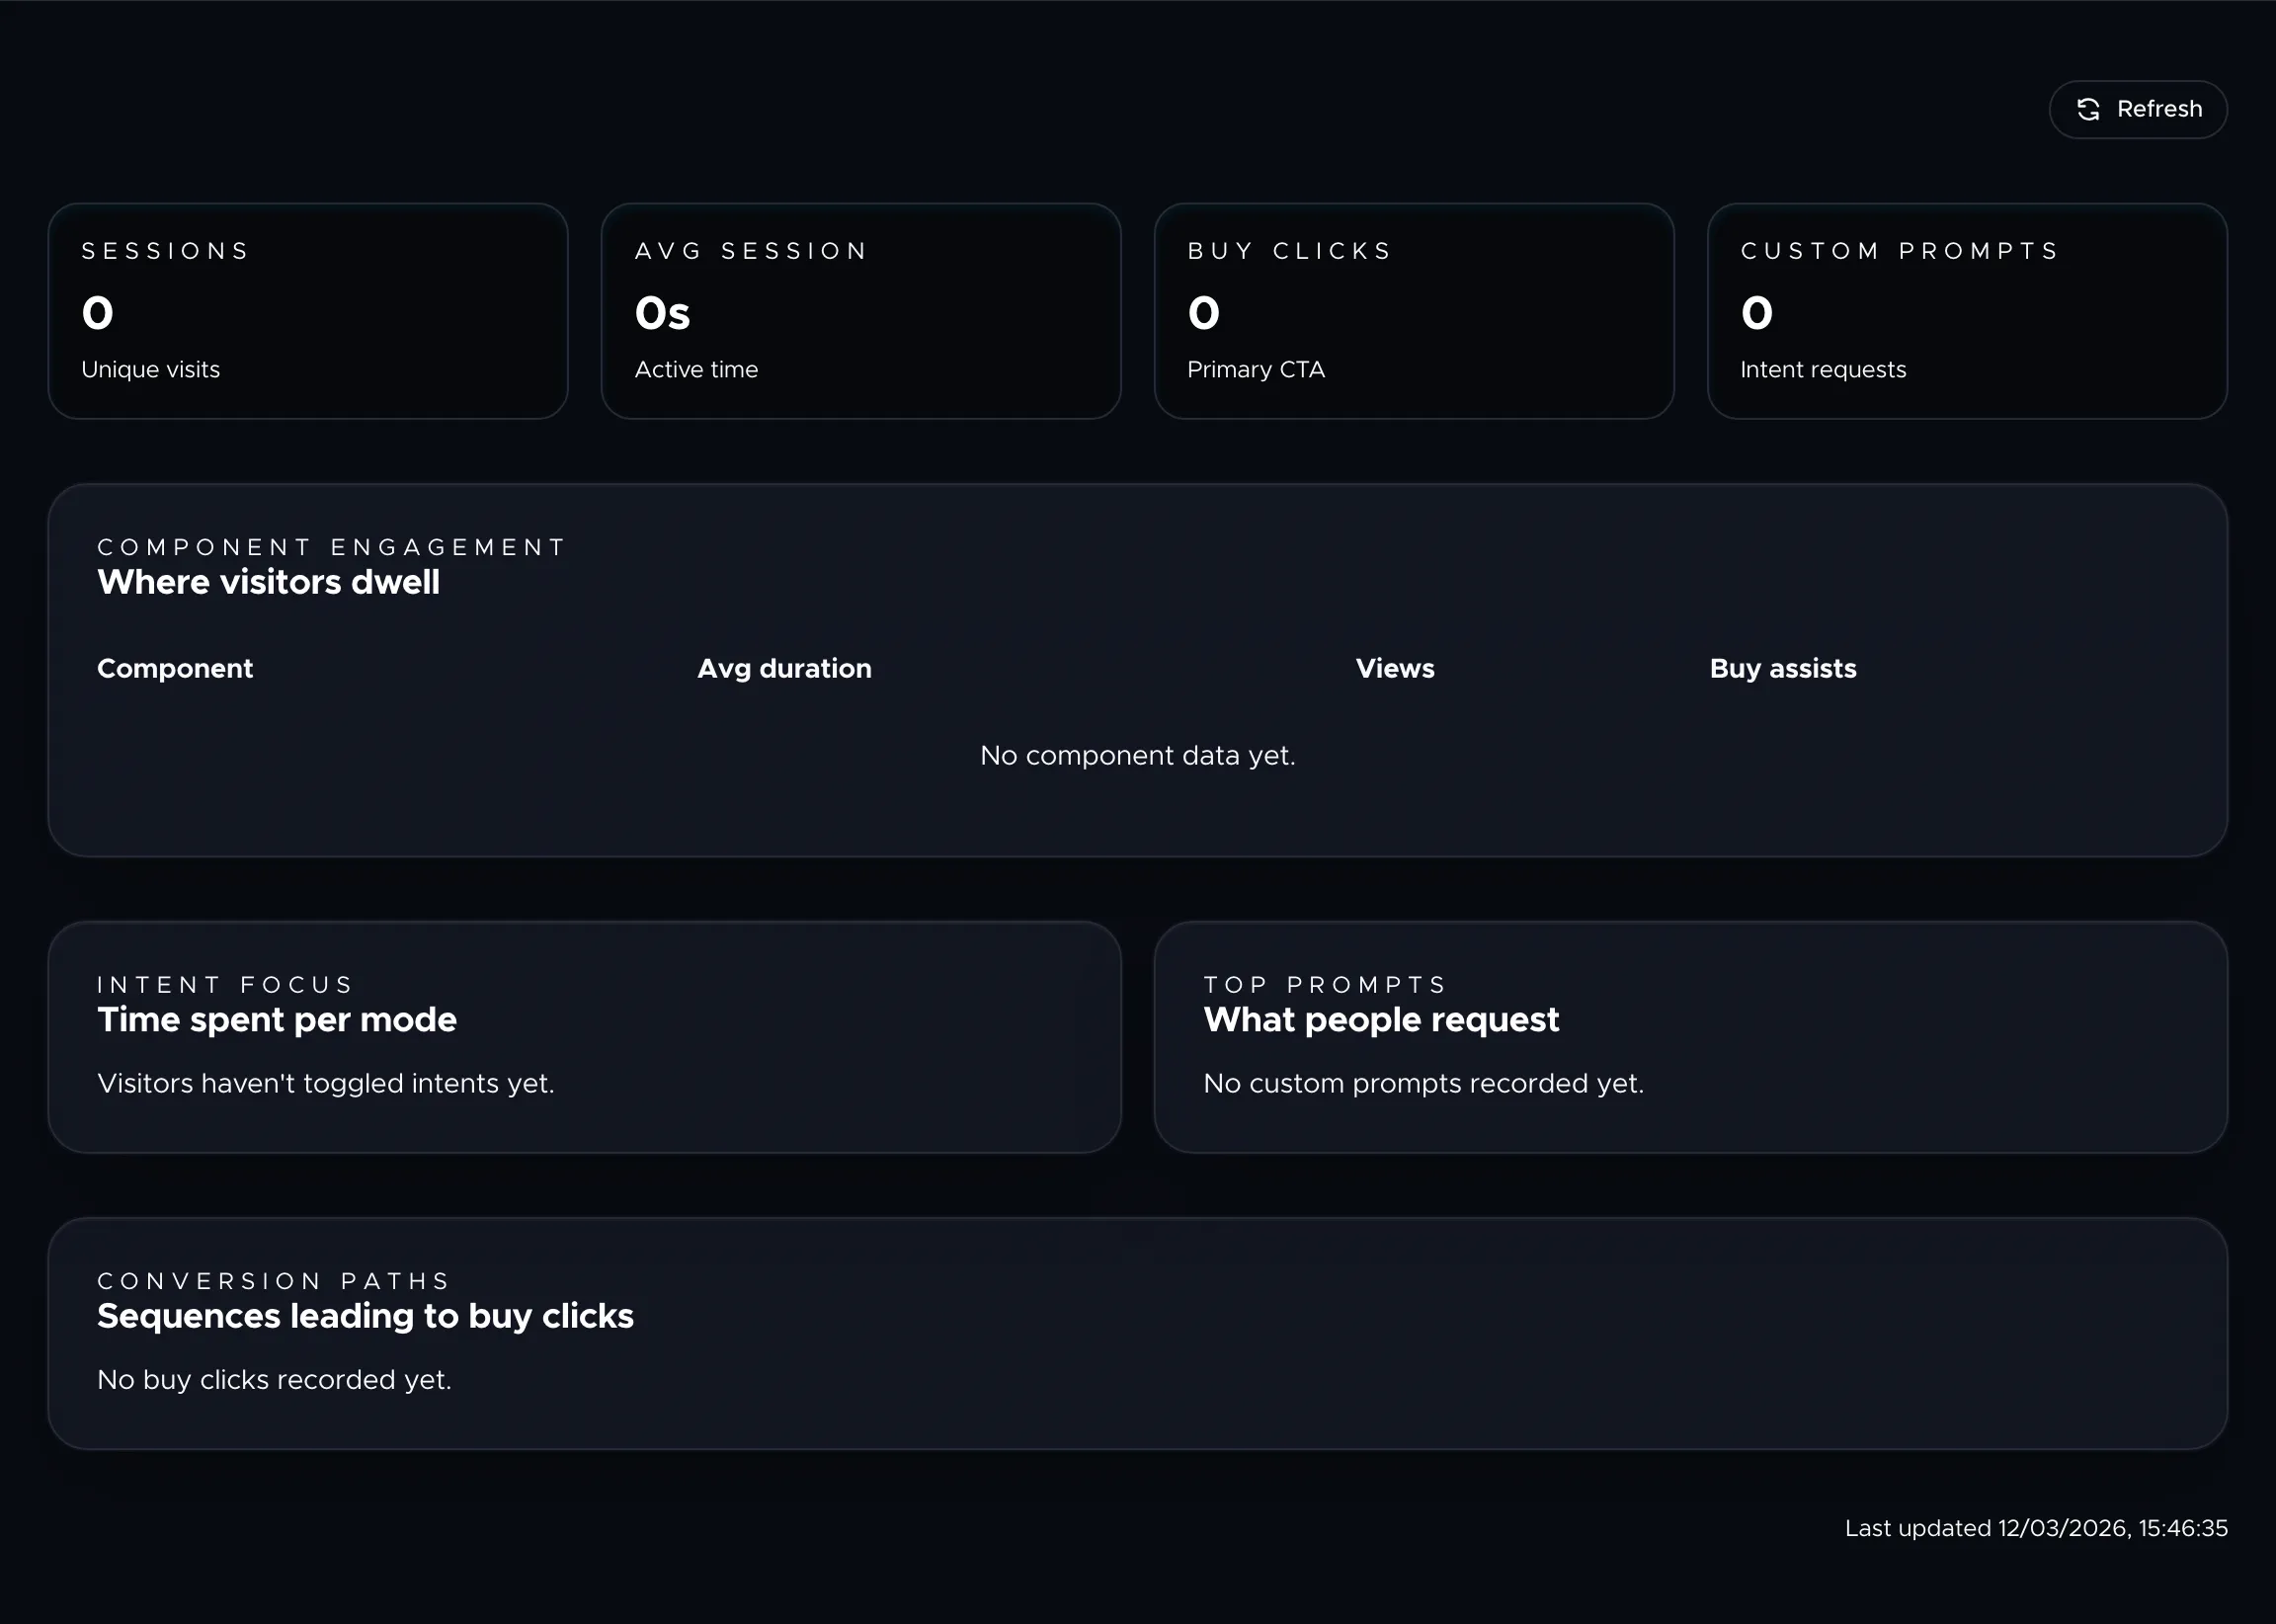
Analytics are available on the Growth plan.
How tracking works
When a session endpoint is configured (which happens automatically on plans that include analytics), the renderer records signals as the buyer navigates. If no endpoint is set, the renderer still keeps an internal score to shape the experience — but data is not stored or reported.
Every action a buyer takes is turned into a signal:
- View — the buyer saw a Thread.
- Dwell — they stayed for a meaningful amount of time.
- Interact — they tapped, opened, scrubbed, or rotated a 3D model.
- Revisit — they came back to the same Thread.
- Branch — they picked one of the "what to see next" choices.
- Query — they typed or spoke a question in the search input.
- Skip — they moved past a Thread too quickly to engage.
These signals build a clear picture of buyer intent and engagement quality.
Funnel depth
Every session has a funnel depth score — a number between 0 and 1 that shows where the buyer is in their journey:
- 0.1 — Awareness. The buyer is just looking around.
- 0.3 — Education. They are learning about features and capabilities.
- 0.6 — Validation. They want proof from others (testimonials, case studies, press).
- 0.8 — Decision. They are comparing options and evaluating pricing.
- 1.0 — Conversion. They are ready to act.
Each Thread adds or removes depth points based on the buyer's interaction. Spending time on a Thread adds points. Skipping it removes points. This makes the experience adjust to the buyer's pace — serving lighter content to someone still exploring and deeper content to someone ready to decide.
Thread confidence
Not all Threads carry equal intent weight. A Thread built from specs, pricing, or case studies gives stronger intent signals than a gallery or overview. Each Thread has a confidence score that acts as a multiplier on all signals.
You do not need to configure this. It is calculated automatically based on the Fiber types inside each Thread.
Short-term and long-term trends
The renderer maintains two trend lines:
- Short-term trend watches the last few Threads. A rising trend means the buyer is engaged and ready for stronger content.
- Long-term trend watches the entire session. With analytics consent on higher plans, this is stored in localStorage so a returning buyer picks up where they left off.
A falling short-term trend signals the renderer to ease off, while a rising trend pushes toward more decisive content.
The Insights tab
On the Growth plan, the Insights tab shows:
- Session summary — total views, interactions, average dwell time, and funnel progression across all visitors.
- Signal breakdown — how many views, dwells, interactions, and skips each Thread received.
- Reports — AI-generated reports that summarize performance trends and suggest specific improvements, like which content to add or which Threads to restructure.
- Search queries — if visitors used the embedded search, their anonymized questions appear here along with a count of how many Fibers matched each one.
When a new report is generated, you will see a notification badge on the Insights tab.
Session continuity
Buyer sessions continue from where they left off. On the client side, session state is stored in the browser so a returning visitor picks up right where they stopped. With analytics consent, sessions can also be tracked on the backend for cross-device continuity and deeper journey insights.
Email reports
If analytics are enabled, merchants receive regular email digests with performance summaries, trend analysis, and recommended next actions. These reports arrive without you needing to check the dashboard.
Next steps
- Daily Reports — how to read and act on your AI-generated analytics reports
- AI Suggestions — get specific improvement recommendations based on your data
- Plans and Pricing — compare plans and see which tier includes analytics